
After an amazingly high number of readers for my last blog post (thanks to everyone who read and shared it), I have starting writing a series of posts on the big question in radiology – will radiologists be replaced by machines in the near future? Geoff Hinton thinks we have five to ten years left, and as one of the handful of top deep learning researchers in the world, when he talks it is always worth listening. Since I want to explore the topic in much more depth than the majority of articles that have popped up recently, it will take some time. But I was distracted when an alert for this paper popped up in my inbox, and I decided to write about it.
The paper was published in Radiology (our top journal) and is titled “Common Data Elements in Radiology”. The authors Dr Rubin and Dr Kahn are famous in the world of imaging informatics, and are probably some of the most recognisable names in the game. Their knowledge of radiology, informatics and computer science outstrips my own by several orders of magnitude, and their clinical and academic experience beats mine by decades. And I think they got something wrong.
Me right now
First of all, let’s talk about the paper. It is about standardised reporting on steroids, using a system of templates with fixed responses in drop-down lists (they call these common data elements, or CDEs). A partial example is included below (Figure 1 from the paper).
A partial example of a CDE for radiology. Maybe it would work as an app?
We all know that standardised reporting is an unpopular topic among radiologists. There has been some limited success in achieving uptake, particularly in oncologic imaging (TNM reports, BIRADS/LIRADS/PIRADS and so on). But mostly radiologists prefer free-form or ‘narrative’ reports. I haven’t seen numbers on this, but my own straw polling comes out at almost 100% against heavily structured reporting.
I actually like structured reporting myself, although I recognise the task of converting radiologists to structured reporting wholesale is somewhat Quixotic. But none of this is where I disagree with the authors.
You see, the authors make a very specific claim in this paper. They say that by hyper-standardising reports by using limited choice “common data elements”, we will improve our ability to use computers to extract meaning from our records. This is a claim about artificial intelligence, and I think it is wrong.
It is all about the information, theoriously.
“It would be of great value if computers could read and understand radiologic reports.”
Rubin, D.L. and Kahn Jr, C.E., 2016. Common Data Elements in Radiology. Radiology, p.161553.
It sure would. But drop down boxes won’t help. In fact, I might even argue that converting radiologists to use CDEs universally in their reports could be an effective way to prevent the automation of radiology. So if you are worried about our future robot overlords, maybe you should get on board the standardised reporting train.
To be clear, I am talking about computers understanding radiology reports. There is no question that template reporting helps with traditional data mining. But traditional data mining (doing things like counting up word occurrences) isn’t computer understanding by any stretch.
More on that a bit later. First let’s look at the problem.
I will start with an example, and then get to the meat of the argument. Consider two sentences:
- “There is a subacute infarct.”
- “There is an abnormality consistent with a subacute infarct although a low-grade tumour cannot be excluded.”
Pfftt. Infarcts and tumours are, like, totally different. You can’t be very good at radiology.
An infarct is a stroke, a blood clot that has gone to the brain, for those who haven’t heard the term.
I’m sure most readers prefer the first sentence. We get told all the time that hedging is bad, that qualifying our statements frustrates our referrers. But let’s assume an equally skilled and motivated radiologist generated these sentences. Do they mean the same thing? If we wanted to “read and understand” these reports, would we say they are equal? Keep this example in mind, we will come back to it.
To the argument. It is a bit complex, and it is going to touch on a field of mathematics and signal processing called information theory. I will try my best to keep this discussion accessible for the non-math geeks out there.
Information theory was proposed by Claude Shannon in the late 1940s as a mathematical way to understand the transmission of information. Telephones were all the rage, and new maths were needed to optimise their use.
This is a very general concept – information goes from one place or time to another, through some medium. It doesn’t only apply to technology. You want to send me an idea, maybe where you want to go for lunch today (always important in radiology). You translate the idea into words in your brain, your mouth moves, the air moves, my eardrums vibrate, my nerves and brain activate and translate these signals into an idea in my head. But how similar are the two ideas, yours and mine? Did it get through ok, or was something lost in translation? Information theory is about efficiently transmitting information, the most idea for the least effort.
You can think of it like Twitter. How much information can you fit in 120 characters? Maybe you can drp sm f th vwls? There are some amazing abbreviations you really should know about. Why use boring words when a :), or a ;), or even a 😮 can do the same job?
This is called compression, just like in mp3 music and zip files. You fit more information in less space. But it doesn’t always work. Audiophiles lament compressed sound quality and prefer FLACs, photographers and digital artists would rather work with TIFF or RAW images. This is because there is a limit to how much you can compress something until it isn’t the same as the original.
These are the two flavours of compression. Lossless or reversible compression means you can squeeze the information down and it is unchanged when you recover it. Lossy or irreversible compression is when you squeeze too hard and something is permanently lost. Maybe the song is a bit crackly, or your image looks pixelated.
This is the key question: can you recreate the original data exactly with only the compressed version and some sort of decompression tool? If yes, your compression is lossless.

Lossless compression was invented in early 2014
Which brings us to the actual point. Drs Rubin and Kahn are advocating irreversible information compression in radiology reports, and our future AI assistants need all that info.
Passing notes in hospitals
The first thing we have to understand is that radiology reports (like most medical records) are relatively information-poor. The vast majority of information a medical expert uses to make decisions is not included in the record, and in fact never even touches the conscious mind of the practitioner. The classic paper on medical decision making and much of the work that follows it suggests that most of the time we rely on pattern matching with stored experience, rather than a conscious application of knowledge.
Since almost all of this is internal and subconscious, we have no record of it. Instead we have a few notes that at worst may be post-hoc rationalisations (not the most trustworthy data for machine learning). Many radiologists understand this subconscious element of practice implicitly. We often say that our decision is made within seconds of seeing a case, just as clinicians often say they know who is sick in a room the second after they walk through the door. That is what subconscious pattern matching feels like.
I could go on about this for ages, and I will probably return to it in a future post (there are some really interesting overlaps with concepts like dark knowledge from Geoff Hinton), but for this discussion we can just acknowledge that we are already dealing with a low-information environment in medicine. We don’t want to make it worse by chucking out more of what we have.
Let us go back to our example.
- “There is a subacute infarct.”
- “There is an abnormality consistent with a subacute infarct although a low-grade tumour cannot be excluded.”
It can be very hard to tell the difference, honest.
Now imagine you are decompressing these two pieces of information. If we assume that the radiologist was trying to be precise, are these sentences expressing the same thing?
What do you think the probability of the patient having an infarct is in each example?
It should be clear that patient two has a lower chance of having an infarct than patient one. The hedging actually implies a different meaning. We hedge to express uncertainty based on a complex array of unstated data. What hasn’t been said? Maybe the second patient had preserved grey-white differentiation, or there was more mass effect than expected, or there was a compelling clinical history for tumour. Maybe it just felt a bit wrong for no reason the radiologist could put into words.
Let’s go further. Rank these in order of likelihood that the patient has a subacute infarct, high to low.
- The differential list includes low grade tumour and subacute infarct.
- Appearances consistent with a subacute infarct.
- There is a subacute infarct.
- Appearances may suggest a subacute infarct.
- The differential list includes subacute infarct and low grade tumour.
- Appearances compatible with a subacute infarct.
Don’t think I can’t see you skipping this learning opportunity.
These are very similar sentences, in terms of word use and dictionary meaning. But a human can read and understand that these sentences are different. We take the concise, compressed wording and we reconstruct the implied meaning.
Maybe you think the list should look something like this?
- There is a subacute infarct.
- Appearances consistent with a subacute infarct.
- Appearances compatible with a subacute infarct.
- Appearances may suggest a subacute infarct.
- The differential list includes subacute infarct and low grade tumour.
- The differential list includes low grade tumour and subacute infarct.
You could probably even put a rough estimate on the probability, if you had written the sentence. Maybe the first sentence is your way of expressing a greater than 99% chance of an infarct, the fourth is something like 75%, and the sixth might be around 40%.
That is a lot of information contained in a few short words of free-form text. Consider then the nuance contained in several lines of description instead of a single sentence.
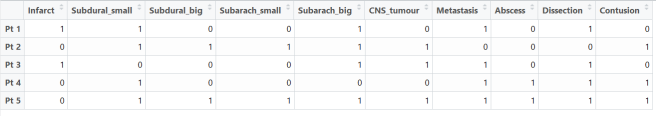
In contrast, a CDE reduces everything to a limited set of choices. If we imagine posing each question as a binary choice (not that Rubin and Kahn advocate this), we could define the 50% certainty threshold as our decision boundary. Now we can’t tell the difference between sentence number 1 and number 5.
- Infarct: present.
- Infarct: present.
- Infarct: present.
- Infarct: present.
- Infarct: present.
- Infarct: absent.
Where is all my information?
Now, I’ve actually simplified this a little, and in doing so I have elided the human approach to the problem. Humans not only decompress the information they receive, but they also decode it. A decoder uses a set of rules (a code) to better understand communication. In the case of humans, this is shared knowledge. If a stranger says to you “let’s go to my favourite place for dinner”, the meaning of this will be impossible for you to reconstruct. But if you share that knowledge with the other person, you can recover the exact meaning of the phrase. The decompression relies on information that is not within the transmitted message itself.
This doesn’t affect the argument, but it is worth considering in the context of text analysis in medicine. Doctors have a huge shared body of knowledge they rely on to communicate, and medical notes are communications between doctors. They transfer information through time, via the medium of the page, in quickly scribbled shorthand. A lot of the compression of this information relies on encoding.
Deep learning systems are great, but we don’t yet have the capacity to teach them complex, multi-domain codes like “medicine”. This might be a hard limit to how much a deep learning model can recover from medical text alone.
But these networks do learn a great deal, and since they don’t have this decoder it raises the question – how do these systems learn?
Can we teach a machine to love understand?
Rubin and Kahn are clearly thinking about what we might call ‘traditional’ data analysis. By using a limited set of keywords (a lexicon) and a restricted range of options, we can do statistical analysis very easily. Each case is a row in a spreadsheet, and each keyword has a score.
Spreadsheets, the cleanest of sheets.
We call this ‘clean’ data, because it is so well organised. From here we can do great things*. Like keep track of trends in your population. Identify patient subgroups. Improve safety by auditing scan usage and outcomes. This sort of data is just great for human-guided analysis. But that is the point. We still need humans to understand it.
But what about machines? How could artificial intelligences understand text?
Deep learning is the closest we come to human-like understanding in computers. For example, deep learning systems can recognise objects in images by identifying the features of similar objects they have learned from previous examples. So the system identifies a dog by the presence of fur, the canine body shape, the relative size compared to other objects, common dog actions and poses, and so on.

What makes a dog a dog? Pepperidge farm Deep learning remembers.
This seems a lot like understanding what a dog is, visually at least. It is also why many people are worried about the future of radiology – there is no reason the same techniques can’t recognise lung cancer by shape, location, background lung appearance, associated features like lymphadenopathy and other complex things that humans can learn to recognise but computers haven’t been able to see until recently.
In fact, there is no reason these techniques can’t work better than humans, like they have in object recognition since early 2015.
These techniques are fairly general, and so we can teach machines about text in the same ways. They learn “language” by example, which letters and words go together to express concepts. This set of tasks (called natural language processing) have been a bit more resistant to deep learning than computer vision, but the models are getting pretty darn good.
In fact, from some of my own work: I was supervising some undergrad computer science students doing deep learning this year, and we trained language models to generate radiology reports. The remarkable thing is that these models worked by choosing individual letters, one at a time. The computers learned spelling, punctuation, syntax, grammar and even what concepts fit together in sentences, paragraphs and report sections.
An example of our work is included below:
CT HEAD
CLINICAL HISTORY: CONFUSION.
TECHNIQUE: PLAIN AXIAL SCANS FROM BASE OF SKULL TO VERTEX.
REPORT: THERE IS NO ACUTE INTRA OR EXTRA AXIAL HAEMORRHAGE. NO EXTRA AXIAL COLLECTION. THERE IS NO SPACE OCCUPYING LESION.
COMMENT: NO EVIDENCE OF ANY MASS LESION OR MASS EFFECT.
While this computer generated report is cool, it is completely old-hat for deep learning.
Like in images, where the systems learn to recognise a dog from its features, in text understanding the networks discover useful “features” of text. They learn that headings are important, and that certain combinations of letters occur after one heading but not another. They learn that two sentences in the same report shouldn’t contradict each other. They learn that the longer a sentence is, the more likely the next character is a period.
Without the medical decoder, it isn’t complete understanding. But it is a very good approximation of what can be learned in the reports alone, and it turns out that this level of understanding is still very useful.
We can look at other parts of image analysis to understand this. The holy grail for computer aided diagnosis is multimodal or sequence-to-sequence learning. You feed in all your scans, all the matching reports, and your system learns a model that turns images into reports.
You know, does diagnostic radiology.
Like, all of it.
Is this plausible, using only the information contained in text? Believe it or not, when we are talking about photos, this works quite well. Take an image, turn it into text that describes it. No human involvement, no decoder that understands the complex multimodal stuff that humans do about objects and scenes. Just a computer program that can process thousands of images per second for under a cent of electricity.

Wouldn’t it be a vegetable stand? Silly computer.
To do this we need good training data. The above system was trained on images and human-like descriptive text. If the example caption for that image had said something like “vegetable: present, human: present” the results would not be anywhere near as impressive.
So what is it about descriptive text that is useful in these models? How does the additional information get used?
The geometry of disease
I’ve said two things that seem to contradict each other. One is that humans have a vast store of pre-existing knowledge that is complex and multimodal and therefore cannot yet be squeezed into a neural network. The other is that outside of radiology these systems work very well combining text and visual understanding.
So which is it? Can machines understand reports without the human ability to decode them?
The answer is a definite “sort-of”. Neural networks are very good at learning the useful structure in one domain (like images), and mapping it to another domain (like text). The do this by finding “universal” representations of things, a way to describe an object or concept in a vector of numbers that is the same whether you are talking about what it looks like, or how it is used in a sentence.
[0.23, 0.111, 0.4522, 0.99 …]
An example of what a sentence vector might look like. They are usually >100 numbers long.
A good example is Google’s translation system, which it trained on various language pairs to transform sentences between the languages, but even works quite well on language pairs it hasn’t seen before. The vector representation of a sentence can be considered an “interlingua” or universal language.
The key here is that what is learnt and stored by these models are the relationships between concepts, and this is really nicely visualised by exploring the geometry of the vectors.
Last week I said that we need to have a good understanding of the medical task we want the machine to perform. So what are radiology reports trying to express?
If you boil it down to the essence, we want to our reports to describe the image variation relevant to diagnostic and treatment decisions. This is what we want our models to learn too, and things like grammar and punctuation are pretty much irrelevant (which is why the generated report above is cool but unexciting).
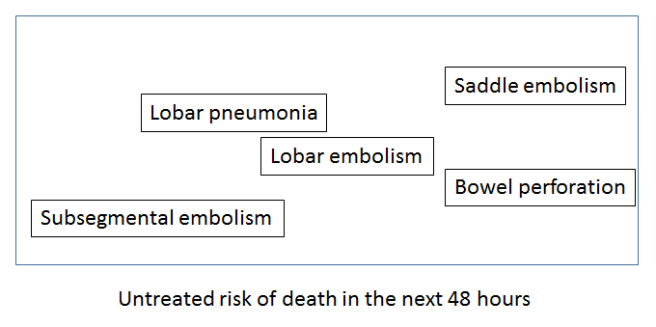
So let’s try to visualise this useful variation (please note that these visualisations are not from data – I have made them up to illustrate the concepts). If we took a sentence about pulmonary embolism (blood clots in the lungs), what elements of that sentence define untreated mortality risk, and therefore the need for treatment? Doctors know that the size of the clot is the most important feature in an untreated patient. Since this is almost always described in the reports, it can be learned by a computer.
We could visualise this by embedding the text in a ‘mortality space’ where there is increasing mortality risk as we go from left to right. Ignore the Y-axis, it doesn’t reflect anything here. It is just easier to show on a page in a two dimensional plot.
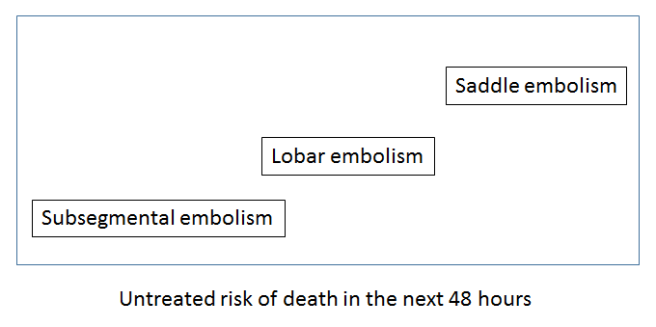
Understanding common variants in terminology is trivial for these systems, so a ‘large main pulmonary artery PE’ would be located around the same place as the ‘saddle embolism’.
The key thing to appreciate here is that if a system understands reports, this mortality space will be universal. A mortality interlingua. Any report observation could be placed into this space and the location in the space would relate to the risk of death.
The other interesting thing about these sort of spaces is that you can perform arithmetic within them. You can add concepts together, subtract them and so on.
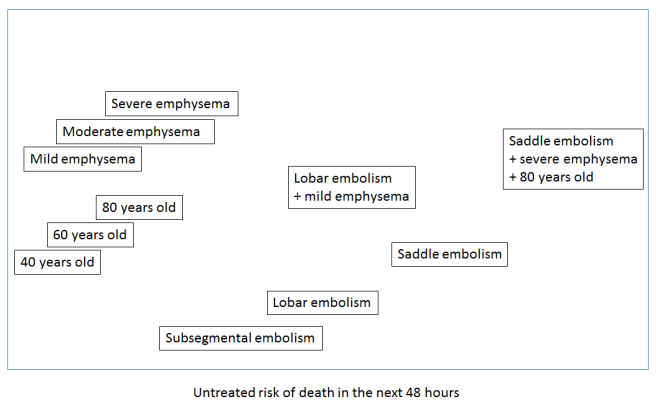
This is how deep learning systems might develop an ‘understanding’ of reports. They learn the useful relationships, like mortality risk.
So how would we learn this ‘mortality space’? We would need the outcomes – how many untreated patients died, and the inputs – the reports. This isn’t something we could ever do for ethical reasons, but it serves to illustrate the idea of a conceptual interlingua.
Let us return to our holy grail though. We want to learn an image to text interlingua for radiology, so we can put in a scan and output a report. We can visualise this space too, which would be learned by identifying the variation in the images that matches the variation in the text.
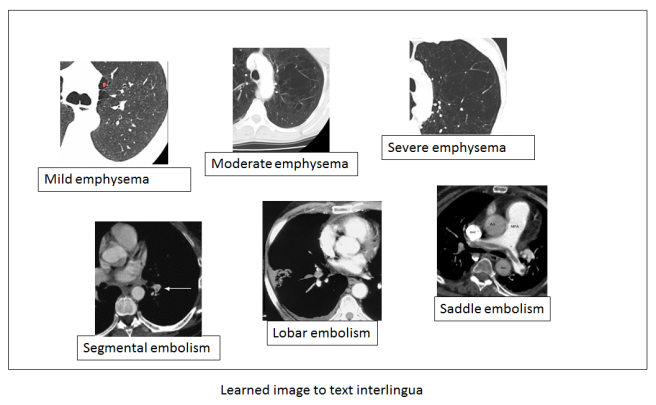
In this example, the left to right axis appears to reflect the concept of mild to severe variation in a disease – a feature that is described in reports and can be learned from the text alone. Note also that while the text is discrete (mild, moderate, severe), the images are not. This type of system should be able to recognise a case halfway between mild and moderate even if that ‘position’ in the spectrum has never been explicitly described in the text.
You can imagine other useful and predictive spectra of disease as well that aren’t directly related to size or scale. How aggressive a tumour looks, the shape of an abdominal aneursym, and so on.
Because of this, there is even more promise here beyond simply automating radiology reports. We can apply this new mathematically defined understanding of useful image relationships to further research. We could take other data (like mortality outcomes) and explore how the outcome varies with location in the image space, and maybe learn entirely new things about predictive radiology.
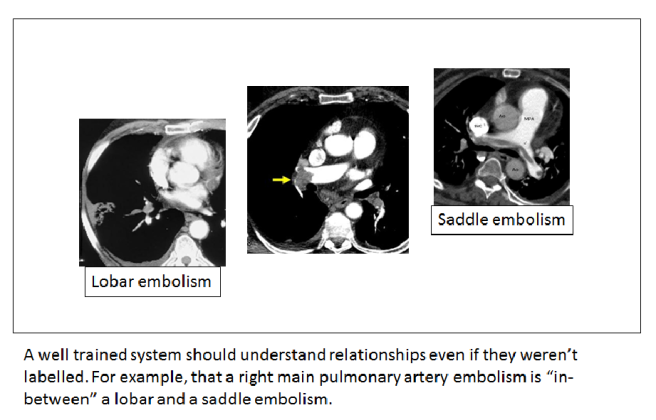
But back to the topic at hand. What if we did not have rich, descriptive reports? What if we only have labels that say a disease is present or absent? Then our space doesn’t look as useful.
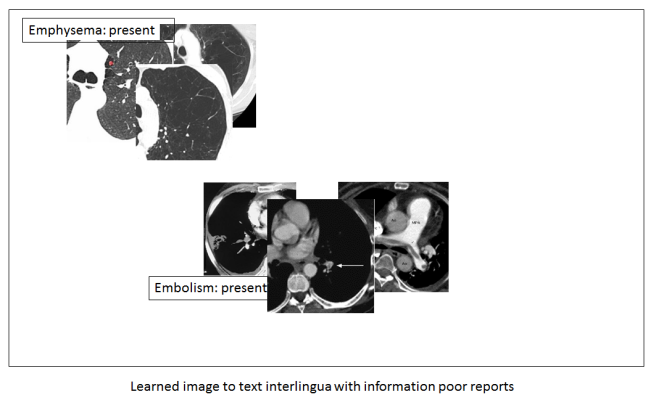
You can see that we no longer have these beautiful disease spectrums. We can only identify that the disease is there, exactly as the label described.
It should be clear that to fulfil the true promise of medical AI, these systems need all the information we can give them. They are actually very good at sifting through too much information to find the useful stuff, but they can’t create information from nothing. They can’t reverse lossy compression. And this is why strict lexicon based reporting could hurt us in the long-run.
Potayto-Potahto
I don’t think I really disagree with Rubin and Kahn (phew), because I think we are talking about different things. They are interested in the type of data analysis we use in 99% of radiology research today, and I’m talking about the stuff that is going to be the future of our field. It isn’t even really about their paper. It is about the more general push to limit the nuance in radiology reports, restricting our vocabulary, reducing hedging and qualification. CDEs are just the extreme version.
The issue here is that many strong voices are promoting standardised reporting. RSNA is a leading proponent, which really means something considering they are responsible for the biggest conference and the most widely read journal in radiology (among many other things). There are tons of articles on the topic, all pro-standardised reporting. There are opinion pieces and keynote speeches.
I can forsee the argument that we can just make CDEs more complex, and that no-one (especially Kahn or Rubin) is recommending binary questions. We could add descriptors like ‘mild’, ‘moderate’ and ‘severe’ for example.
But there is a limit here. The more long drop-down boxes, the more clicks, the more barriers from thought to page, the less satisfying the experience. Front-end developers and usability experts know this well. In my own hospital the radiologists rebelled against using a single (long) drop down box to protocol studies, a simple process of click, scroll, click. They chose to go back to a tick-and-sign paper form rather than use the electronic system.
CDEs are much the same. They might be used, but only if they are easy and fast. That limits how complex they can be, and there is definitely no way we can capture all of the variation of free-text reports in CDEs.
The key point is this: any limit on our reporting language now may be good in the short term, but in the long run it could hurt the development of AI systems.
I don’t know how important this is in the context of radiology. It might be only a minor impediment with big short term benefits. It could be a major stumbling block. If Geoff Hinton is right, and we only have 5 to 10 years left in radiology as it exists today, should we continue putting effort into standardisation? These questions have never been explored, and we should be thinking about them.
It is up to those of us who work with AI to talk about this. If we go around saying things like “standardisation will help machines understand reports”, we might be giving the wrong impression to an audience of radiologists who see self-driving cars in the news but have never heard of a linear model.
Anyway, I’m going to knuckle down to write something about my upcoming series on automation in radiology, so it might be a little while until my next post. See you then!

Good insight about lossy compression in reporting.
LikeLike
brilliant really! you hit it in the head with this bit:
“these systems (AI) need all the information we can give them. They are actually very good at sifting through too much information to find the useful stuff, but they can’t create information from nothing. “
LikeLike
Excellent article!
I wonder if we are inadvertently using CDEs in reporting as a replacement for checklists.
There can be useful information conveyed by choosing to exclude a finding in a report as much as including it.
A checklist can help ensure the clinician has thought about a critical piece of the appraisal.
Combining a checklist, with narrative reporting may allow for minimising human error while ensuring the information contained in the subtlety of natural language remains for the benefit of both current human beings and AIs of the future.
LikeLiked by 1 person
Hi Luke, the best phrase in this excellent blog is “It is about the more general push to limit the nuance in radiology reports, restricting our vocabulary, reducing hedging and qualification. CDEs are just the extreme version.” And you are right, this is what we should start doing. But the fact is that nowadays there is no real commercial tool allowing us to do so. Most systems used are home-made and thus often too cumbersome or difficult to sustain and upgrade; they need manpower and financial resources. The thing is that we will evolve to a more easy-to-use system as soon as the algorithms are improving and becoming smarter, able to smoothly and seamlessly integrate their image analysis findings in an automatically generated report. But in the meantime I think we could start using a more limited version of structured reporting, in which some free space is available to add some more “nuance” to the findings (such as a differential diagnosis, some uncertainty – medicine nor radiology are an exact science). Maybe not for all reports, but for the more standardised types of examinations such as staging of rectal cancer and prostate cancer with MRI. This would certainly facilitate the development of better algorithms. Structured reports are actually part of the entire so-called AI-ecosystem, in which everything is optimally integrated so that the engine runs, making the vehicle move forward so that it can reach its final goal – providing better care to our patients.
LikeLike
Hi Erik. I totally agree. As we heard from many in Paris, the gathering and cleaning of the data is the majority of the effort in building these systems. CDEs and standardised reports can help.
I was just thinking a lot about the tension between ease of access (CDEs) and maximising information (unstructured reports). The trade-off is real, I think.
On balance though, it is probably a net good for AI if we use CDEs because we will save so much time and effort 🙂
LikeLike
Hi Luke, yes it’s a net benefit for SR I think. We need to get over a threshold, and the step will be made by adapted / interoperable and seamless integrated software in combination with a mind shift. The mind shift for SR is similar to the one we have to make for AI I think, and I wonder how long it will take before radiologists are able to go forward with AI…I hope it will go faster than with SR.
LikeLike